No matter how perfect your code and how optimized the way you have written is, facing a situation of getting a deadlock is inevitable. And it would make the situation even more complex when you know that a deadlock had occurred but you have no clue which the victim and perpetrator was.
There are few ways to capture and analyze a deadlock. I will explain two ways in this post.
- Enabling trace flags to capture/log deadlock information into SQL Log
- Use SQL Profiler to capture a deadlock.
Enabling trace flags to capture/log deadlock information into SQL Log
This method will make sure that the deadlock details are logged in the SQL log file (not the transaction log). Even though the details which are captured via this method is textual it gives you the option of inspecting the details at a later time.
First you need to enable the trace flags using the following syntax:
DBCC TRACEON (1222, 1204, -1)
Afterwards we will simulate a deadlock : (in reality you don’t need to do this if you are facing such issue)
First create two sample tables and insert few records which we will use to produce a deadlock.
-- Create a Sample Tables --

CREATE TABLE SampleDeadLock_1(
    Item_Code    INT
    ,Item_Desc    VARCHAR(100)
    ,Qty        INT
)

CREATE TABLE SampleDeadLock_2(
    Item_Code    INT
    ,Item_Desc    VARCHAR(100)
    ,Qty        INT
)

-- Insert couple of records to each table --

INSERT INTO dbo.SampleDeadLock_1(
    Item_Code
    ,Item_Desc
    ,Qty
)
VALUES
    (1,'CPU', 10)
    ,(2, '20 GB - Hard Disk', 20)

INSERT INTO dbo.SampleDeadLock_2(
    Item_Code
    ,Item_Desc
    ,Qty
)
VALUES
    (3,'Monitor', 15)
    ,(4, 'Keyboard & MOuse', 25)
Now open two query windows in SQL Server Management Studio (Window 1 & Window 2) and paste the following code to ‘Window 1’
BEGIN TRAN

UPDATE dbo.SampleDeadLock_1 SET Qty = 100 WHERE Item_Code = 1

WAITFOR DELAY '00:00:30'

UPDATE dbo.SampleDeadLock_2 SET Qty = 200 WHERE Item_Code = 3
And paste the following code to ‘Window 2’
BEGIN TRAN

WAITFOR DELAY '00:00:10'

UPDATE dbo.SampleDeadLock_2 SET Qty = 300 WHERE Item_Code = 3
UPDATE dbo.SampleDeadLock_1 SET Qty = 400 WHERE Item_Code = 1
Afterwards execute the code in Window 1 and immediately execute the code in Window 2. After few seconds (30+) you will see a deadlock error message in Window 1.
And when you checked on the ERRORLOG file, you will be able to find out the relevant details which relates to the deadlock. (I have highlighted the deadlock victim details in Red and the perpetrator details in blue)
Using SQL Profiler to capture a deadlock (Deadlock Graph)
One of the issues we have in the aforementioned method is that we need to look into lots of textual information in order to extract the details which is relevant for the deadlock. In this example it’s somewhat easier since we had chosen a simple situation. But things could get real hard during an actual situation where the processes are bit complex.
In such case (any case), we can use the SQL Profiler to detect the deadlock in a more user friendly manner.
** Please Note: Down-side of this method is you need to have the profiler running during the time that the deadlock had occurred. And this isn’t the best way if you need to troubleshoot in a Production Environment.
How ever for the sake of understanding we will see how we can achieve this.
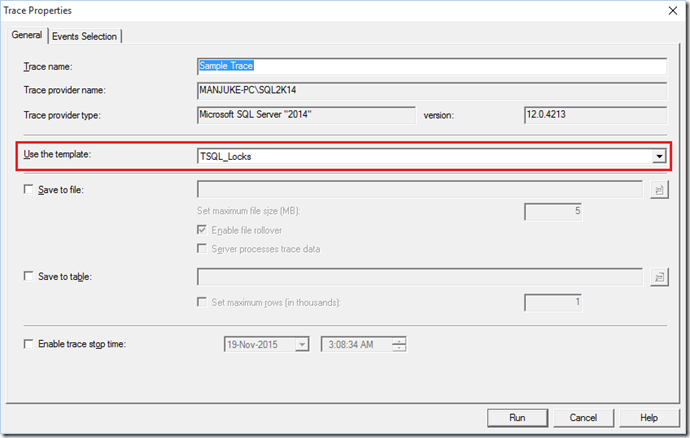
Open the SQL Profiler and connect to the relevant SQL Server. And in the ‘Trace Properties’ window choose ‘TSQL_Locks’ as the template.
And in the ‘Event Selection’ tab, please choose the following options.
- Deadlock graph
- Lock:Deadlock
- Lock:Deadlock Chain
Before click on running the profiler, Rollback the transaction which is running from the first example (The one which didn’t become the Deadlock Victim)
Start the profiler by clicking the ‘Run’ button. And once the profiler is running, execute the code on Query Window 1 and afterwards execute the code in Query Window 2.
Once the deadlock occurs the Profiler will display the relevant information in a graphical manner. This will contain all the relevant details which is required in order to troubleshoot the deadlock. And if you hover the cursor over the processes in the graph (shown in ellipses) a tooltip will be displayed along with the statement which has been executed, which caused the deadlock to occur.
I hope this will help you in order to troubleshoot a deadlock situation.


No comments:
Post a Comment