Showing posts with label SSRS. Show all posts

Sunday, 3 January 2016

SSRS - Loading and Using A SQL Server Database Image

This blog entry discusses how to add an image to SQL Server for storage within the database, followed by how to use it in SSRS.
When including an image within a SQL Server Reporting Services report, you have 3 options:
  1. Embedded.  The image is embedded within the report.  This is my least favorite choice, as it’s not easily reusable and maintenance of a change would be a big headache if very many reports existed with individual embedded images.
  2. External.  The image is loaded to the Report Project and may be reused among multiple SSRS reports.  This approach was discussed in this ImagePaths in SSRS entry.  
  3. Database.  The image is loaded to a SQL Server database and, like option 2, may be reused among multiple SSRS reports.  Because it’s stored in the database, it can be used for many other types of solutions as well.  This is the most flexible of the 3 options - and the topic of the rest of this entry.

Using OPENROWSET to Insert Image Into Table

1.  First, let’s create a table in SQL Server Management Studio to hold the image file.
CREATE TABLE dbo.Images
(
      [ImageID] [int] IDENTITY(1,1) NOT NULL,
      [ImageName] [varchar](40) NOT NULL,
      [OriginalFormat] [nvarchar](5) NOT NULL, 
      [ImageFile] [varbinary](max) NOT NULL
 )    
Note that the data type we’re using for the image is varbinary(max) instead of the image data type.  That’s because the image data type is being removed in a future version of SQL Server.
2.  Right-click this dog image and save it to your c:\ drive as “MyImage.png”.
  
3.  Now let’s insert the dog image into the database table we created in step 1.
INSERT INTO dbo.Images
(
       ImageName
      ,OriginalFormat
      ,ImageFile
)
SELECT
      'Sample Image'
      ,'png'
      ,ImageFile
FROM OPENROWSET(BULK N'C:\MyImage.png', SINGLE_BLOB) AS ImageSource(ImageFile);
That’s it!  Now you’re ready to use it.  I like to include an “Original Format” field so that I can easily remember what to set for the MIME type in SSRS.

SSRS Image Properties

In this section we’ll discuss how to use the database image in SSRS.
1.  First, create a dataset within your report which contains the following query.  I’m calling my dataset “HeaderImage.”
SELECT ImageFile
FROM dbo.Images
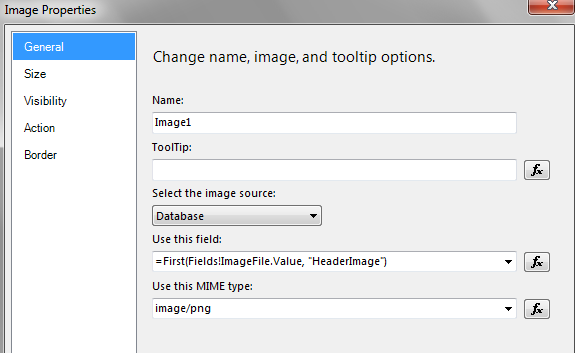
2.  From the Toolbox, drag an Image Report Item onto the body of the report.  Configure it as follows:
Select the image source:  Database
Use this field:  =First(Fields!ImageFile.Value, “HeaderImage”)
Use this MIME type:  image/png    (this is the MIME type & subtype, which classifies file types on the web for consistent handling between browsers & O/S)


And voila, you have a drooling puppy on your report - just what you've always wanted! 

Saturday, 2 January 2016

SSRS - Drillthrough report in SSRS Step by Step

Drillthrough report in SSRS

A Drillthrough is a kind of report that a user opens by clicking a link within another report. Drillthrough reports commonly contain details about an item that is contained in an original summary report. The data in the drillthrough report is not retrieved until the user clicks the link in the main report.

Here I am showing you how to create Drillthrough Report.
For this I am creating two Report  i.e. Parent and Child Report.

Here is an example from  AdventureWorks Database for Parent Report.


SQL Scripts
SELECT        CustomerID, ContactID, Demographics, ModifiedDate
FROM            Sales.Individual

Now insert a table and  Format the column


And Now create a Child Report
Here I am also using  AdventureWorks Database for Child Report.


SQL Scripts
SELECT        CustomerID, ContactID, Demographics, ModifiedDate
FROM            Sales.Individual
WHERE        (CustomerID = @CustID)

Here I am creating a Parameter Custid.

Here both report created and now its time to map the parent report to child report. For this
We go to the parent report [CustomerID] column.

Right click on [CustomerID] column and choose Text Box Properties


Go to Action tab and map these:


Then Click on OK.

And now run the report. Below the preview of Drillthrough report.


SSRS - Alternating Table Row Color In SSRS Step by Step

Alternating Table Row Color  In SSRS Step by Step

Here is an example from AdventureWorks Database.


Sql Script.

SELECT TOP 1000 [StateProvinceID]
      ,[StateProvinceCode]
      ,[CountryRegionCode]
      ,[Name]
      ,[rowguid]
      ,[ModifiedDate]
  FROM [AdventureWorks].[Person].[StateProvince]

Select the Header Row of the table in the report.
Go to Properties Window.
 Under the BackgroundColor property, Select color from drop down.

Now, Select the Data Row of the table in the report.
Go to Properties Window.

Under the BackgroundColor property, select expression from the drop down.
Enter the expression "=IIF(RowNumber(Nothing) mod 2 = 0, "SeaGreen","Pink") " in the Expression Window.
Click OK.
Below is a Preview of a SSRS report with two different colors for alternate rows.


SSRS - Create SSRS report using Excel Data Source Step by Step

By creating a report using Excel as a Data Source we will follow the following steps ...


Right click on Shared Data Source folder and choose Add New Data Source. A new popup screen will open. Give the Data Source Name and Choose ODBC from the dropdown box.


Then Click on Edit button. A new screen will open. From the new screen i.e. Connection Properties go to the Use user or system data source name and from the drop down choose Excel Files .


Then Choose the Use Connection String and click on Build button. A new pop up screen will open . Click on New button.


Then click on Next button


Choose the Microsoft Excel Driver and click on Next button and then click on Finish button.


Then click on Select Workbook button and choose the file and click on OK button.


Click on OK


Test the connection and press OK.


Click on OK.
Click on Reports folder and choose add new items and choose Report. Map your Data Source and click OK.


Right click on Dataset Folder and Write the query for the table. (I have used a very simple query .For ex.)


This is Your Report from Excel data source.


SSRS - Page Break at Nth row in SSRS Report

We can design a SSRS report with a constraint of only Nth rows per page.

I am showing you that how to display only Nth rows in the report in this article.

Here is an example from  AdventureWorks Database.

SQL Scripts.

SELECT TOP 1000 [StateProvinceID]
      ,[StateProvinceCode]
      ,[CountryRegionCode]
      ,[Name]
      ,[rowguid]
      ,[ModifiedDate]
  FROM [AdventureWorks].[Person].[StateProvince]

Select the Header Row of the table in the report.
Go to Properties Window.
 Under the BackgroundColor property, Select color from drop down.


Now create a group.


After creating the group go to the group properties and click on fx button.


And set the expression for group properties.


Expression :
=Ceiling((RowNumber(Nothing)) / 15)

( Note : You can put Nth number in place of 15. For example if you want to your page break affect after each 25th row than you have to put 25 in place of 15 )  

 Now, report will show 15 rows in a group. Next step is to define page break for the group. Go to page breaks tab and select page break option.


And now run the report. Below the preview of report.


OR

This implementation topic has page break configuration in the report.
Step 1: A simple design to show all rows in a table using table component.
Step 2: Add a parent group to the detail row
Step 3: Add group expression “=Ceiling((RowNumber(Nothing)) / Nth row)” i.e. “=Ceiling((RowNumber(Nothing)) /50)” and Click OK
Step 4: You may get the following error if you run the report after step 3.
Step 5: Open Row group properties and remove sort expression.
or explicitly cut and paste the same experssion in sort box.
Step 6: Now, report will show 50 rows in a group. Next step is to define page break for the group. Go to page breaks tab and select page break option
Step 7: Now, hide the group header and detail column from the table component and run the report.